How does the mass of new data on inequality in wealth and income relate to discussions about class and power in America? Question prompted by some very striking data compiled by Phoenix Marketing International on the wealthy in the US.
What is interesting about this data is that it focus on an unusually exclusive definition of wealth, “Investable Assets”. Investable assets include education/custodial accounts, individually-owned retirement accounts, stocks, options, bonds, mutual funds, managed accounts, hedge funds, structured products, ETFs, cash accounts, annuities, and cash value life insurance policies. This EXCLUDES real estate and some types of employer-controlled retirement fund.
So, the wealth being measured here is very mobile. It is not tied down in institutional plans or the house you live in. It is money that you can easily “throw around”.
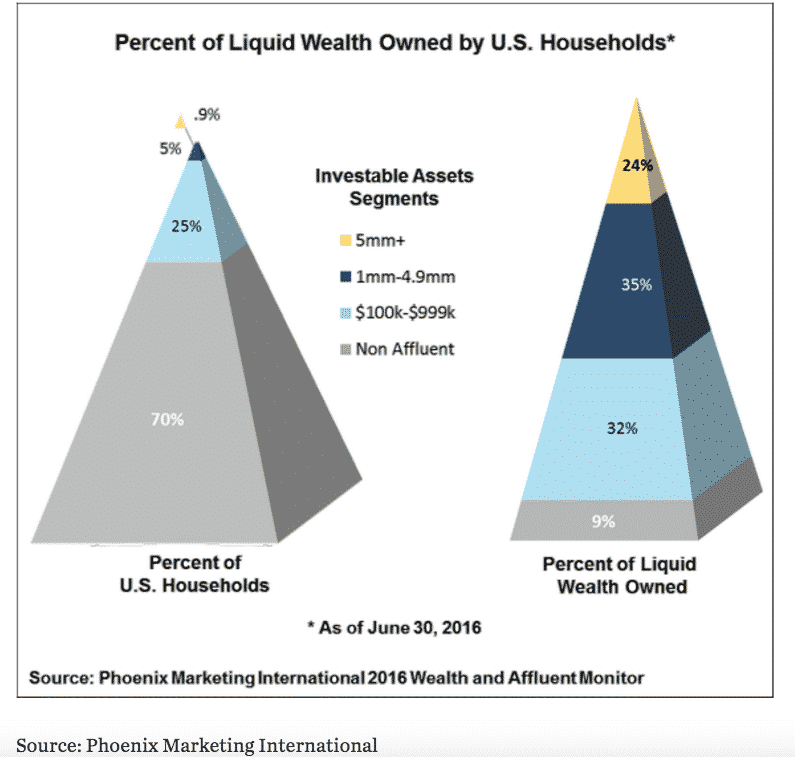
Furthermore, the data is collected on the basis of real decision-making units, households. According to census there are ca. 126 million households in the US 2015/16. Unsurprisingly, the data shows massive inequality. The bottom 70 % of households in the US have less than $100k on this restrictive definition and are of no further interest to the marketeers. Those with more than $100 k in investable assets make up the top 38 million households.
The data get really interesting when Phoenix start breaking down the group that does actually have some liquid wealth and when they start tracking its dynamics.
Roughly 30 million households are in the group that one would presumably want to designate as “middle class” in the classical sense of that word (obviously one could hang a long and complex historical discussion on this bald statement). They have investable wealth between $100k and $1 million.
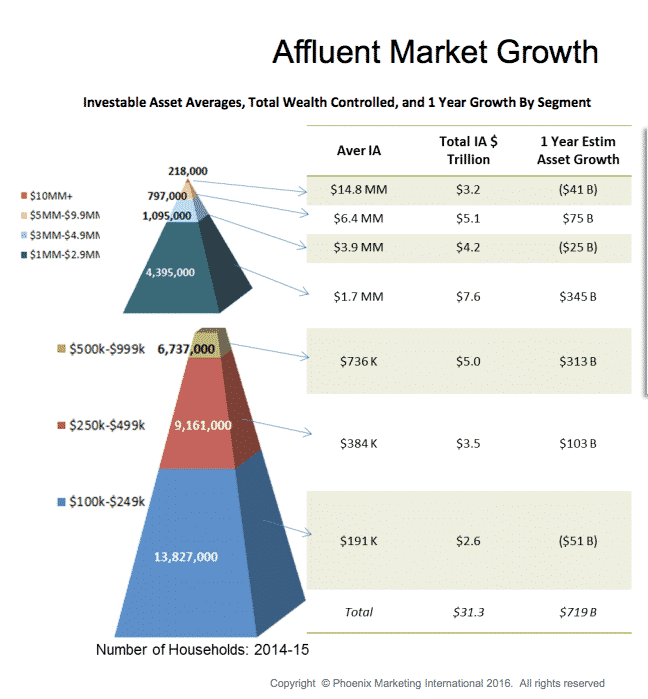
But what really brought me up short is the finding that there are 6.5 million households in the US with $ 1 million dollars or more in investable assets. They control 2/3 of all investable wealth. Of these 4.4 million households are in the $1-$2.9 m range. 2.3 million households have investable wealth above $ 3 million.
6.2 million of these wealth-holding households had “heads” born before 1945. 19.4 million households are headed by baby boomers born 1945-1964. 7 million are Gen X born 1965-1979 and 3.8 million were born 1980-2000. So, more than half those with wealth are probably retired.
The Graphs above cover 2015. The latest releasee of the data came out in February 2017. Phoenix summarizes its results as follows:
“Within the wealth segment, the greatest asset growth was among households with between $1 million and $10 million in investable assets. Their investable assets grew by $809 billion, to a total of $17.8 trillion. By comparison, there are 16.4 million households in the broad affluent market (with between $250,000 and $1 million in investable assets). They control $8.5 trillion in investable assets, or 35 percent of total liquid wealth in the U.S.; however, they lost $56 billion collectively between 2015 and 2016. The vast majority of these losses ($54 billion) were among the lower mass affluent segment (households with $250,000 to $500,000). The 14 million near-affluent households in the U.S. (with between $100,000 and $250,000), saw investable assets decline by $79 billion between 2015 and 2016, to $2.6 trillion. The concentration of wealth in the U.S. continues to deepen as the top 1 percent of wealthiest U.S. households now holds 24 percent of liquid wealth. Non-affluent households, representing 70 percent of U.S. households, control less than 10 percent of the nation’s liquid wealth.”
And the conclusion it draws is striking: ““Our research reveals stark geographic, demographic and economic differences within the broad wealth and affluent market, reinforcing the need for more precise segmentation and targeted, relevant messaging,” said David Thompson, Managing Director, Affluent Practice, at Phoenix Marketing International. “The trends we’ve seen over the past 10 years show a deeper and wider wealth divide as families in the near- and emerging affluent segments fall further behind financially.”
In other words the dynamics of wealth in the US right now are so extreme that they pose problems for effective marketing!