Important new working paper from the entire team of Facundo Alvaredo, Lucas Chancel, Thomas Piketty, Emmanuel Saez, Gabriel Zucman. http://www.nber.org/papers/w23119.pdf
It extends previous work and announces the new database for “Piketty”-style data. “In December 2015, the WTID was subsumed into the WID, The World Wealth and Income Database. In addition to the WTID top income shares series, this first version of WID included an extended version of the historical database on the long-run evolution of aggregate wealthincome ratios first developed by Piketty and Zucman (2014). We changed the name of the database from the WTID to the WID in order to reflect the increasing scope and ambition of the database. In January 2017 we launched a new database and website, WID.world (www.wid.world), with better data visualization tools and more extensive data coverage.”
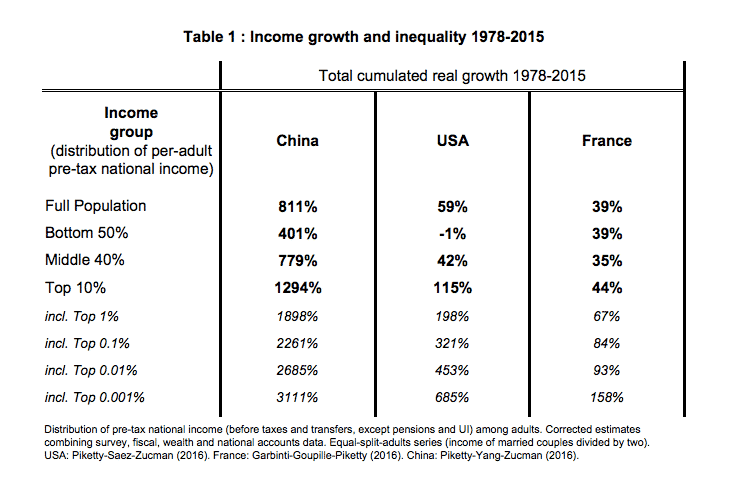
There are many familiar visualizations of income shares, income/wealth ratios etc, but the main take away is one stunning table that shows pre tax national income per capita growth since 1978 for China, the US and France and its distribution.
Again, this is not a radically novel result, but the upshot is stark and could not be more timely.
This is how the authors put it: “The comparison between the US, China and France illustrates how the Distributional National Accounts (DINA) can be used to analyze the distribution of growth across income classes. According to national accounts, per adult national income has increased in the three countries. It should be noted that these series refer to pre-tax, pre-transfer inequality. Post-tax, post-transfer series (in progress) are likely to reinforce these conclusions, at least regarding the US-France comparison. Between 1978 and 2015 the average per capita increase was +811% in China, +59% in the US, and +39% in France. Nevertheless, the performance has been very different across the distribution (see Table). We observe a clear pattern of rising inequality: top income groups enjoyed relatively more growth, while the situation has been very different for the bottom. In China, top groups have enjoyed very high growth, but aggregate growth was also so large that even the bottom 50% average income grew markedly by +401% between 1978 and 2015. This is likely to make rising inequality much more acceptable. In contrast, in the US, there was no growth left at all for the bottom 50% (-1%). France illustrates another type of situation. Very top incomes have grown more than average, but this pattern of rising inequality happened only for very high and numerically relatively negligible groups, so that it had limited consequences for the majority of the population. In effect, the bottom 50% income group enjoyed the same growth as average growth (+39%).”
The fact that pre-tax incomes for the least favored half of American’s citizens have not risen, but have fallen slightly over the last forty years ought to be a show stopper. Literally, all other policy discourse should surely cease. Insofar as there is any kind of reformist agenda it has to focus on this overwhelming and dramatic fact, which implies the breakdown at the heart of global capitalism, of any meaningful relationship between national economic success stories told in terms of GDP and the actual experience of half the population.
Clearly, also, this is the stark reality that frames the frantic, confused and utterly misguided economic nationalism of the current political moment. The perversity is only magnified by the fact that a large portion of the people who have been “left behind” are not “WHITE working class”, but working people of every other color.